.png)


Local School Spending Outpaces State Aid as Enrollment Drops in New Hampshire
- Granite Eagle

- Apr 7
- 3 min read
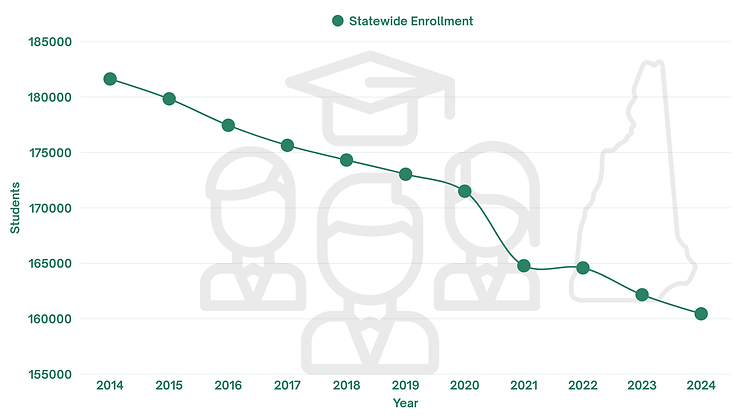
Concord, NH- New Hampshire school districts are spending more on public education than ever before—even as student enrollment steadily declines. At the same time, increases in state education aid, while substantial, have not kept pace with rising local spending, deepening the tax burden on property owners across the state.
To its credit, the state has increased education aid during this time. In 2014, the state provided approximately $566 million in aid to local school districts. By 2024, that figure had grown to more than $701 million—a roughly 24% increase. However, local spending grew by more than 25% in just the 2014–2023 window, and appears to have continued rising in 2024. This means the gap between what the state provides and what local taxpayers must fund continues to wide

In practical terms, the state’s increase in education aid has not been enough to offset the rapid growth in local education budgets. Because New Hampshire distributes state aid primarily on a per-pupil basis, communities with falling enrollment typically receive less state funding unless they qualify for additional need-based or targeted aid. Yet even as the number of students declines, school districts have rarely reduced their overall budgets.
Importantly, decisions about school budgets are made at the local level by elected school boards. These boards determine how much to spend and where the money goes—from staffing and salaries to facilities and support services. While this allows communities to tailor education spending to their local needs and values, it also means that spending levels can increase year over year even in the face of declining enrollment.

Recent examples highlight how local decisions can drive major increases in education spending, even as enrollment shrinks:
Concord is moving forward with a $152 million project to construct a new middle school, replacing the existing Rundlett Middle School. The project was approved in 2023 and will be built on district-owned land behind Broken Ground Elementary. In the last 8 years the School District has seen an enrollment decline of 770 students (-19.7%).
Manchester, the state’s largest school district, approved $290 million in bonds in December 2023 for major renovations and school construction. The district’s enrollment has steadily declined over the past 8 years losing 2,467 students (-17.2%).
Costs associated with personnel, benefits, building maintenance, and capital projects like new school construction are key drivers of continued budget growth. And while some fixed costs may not scale down easily, the result has been a steady increase in per-student expenditures, with a growing share of that burden falling on local property taxpayers.
The financial pressure is especially acute in towns that are losing students but continuing to approve higher school budgets. With state aid increases falling short of matching local spending trends, residents are increasingly left to close the gap through property taxes.
Statewide, education spending makes up an average of 62% of the total property tax bill—by far the largest component. As education budgets grow, so too does the impact on homeowners, especially in communities that rely heavily on local revenues to fund their schools.
This dynamic has sharpened the debate over school funding in New Hampshire. For many, the data reinforces the need to reexamine how schools are funded and how effectively those dollars are being spent. Without meaningful changes, the trend of rising costs and shrinking classrooms is likely to continue—and so is the impact on local property taxpayers.
Expenditure Year | Local Spending | State Aid |
2014 | $ 2,808,230,056.00 | $ 566,274,738.38 |
2015 | $ 2,889,264,309.00 | $ 562,678,126.92 |
2016 | $ 2,971,331,858.00 | $ 570,120,846.04 |
2017 | $ 3,034,391,682.00 | $ 564,007,588.39 |
2018 | $ 3,143,688,548.00 | $ 561,750,904.56 |
2019 | $ 3,256,388,998.00 | $ 552,624,220.37 |
2020 | $ 3,237,279,638.00 | $ 599,249,580.61 |
2021 | $ 3,396,790,638.00 | $ 649,510,185.66 |
2022 | $ 3,576,450,620.00 | $ 624,823,444.62 |
2023 | $ 3,797,488,496.00 | $ 707,519,580.86 |
2024 | $ 3,961,470,560.00 | $ 701,480,824.97 |


Comments